If you haven’t heard, Yahoo’s investment portfolio manager will no longer be supporting transactions. This means that if you want to record all of your buys, sells, dividends, etc., you can no longer do so with Yahoo’s investment portfolio. In other words, you can no longer track the history of your investments. Without a transaction history you cannot get an accurate performance return of your investment and you can’t calculate your gains and losses for your taxes. If you are a user of Yahoo’s portfolio manager and want an alternative, consider EquityStat’s portfolio manager.
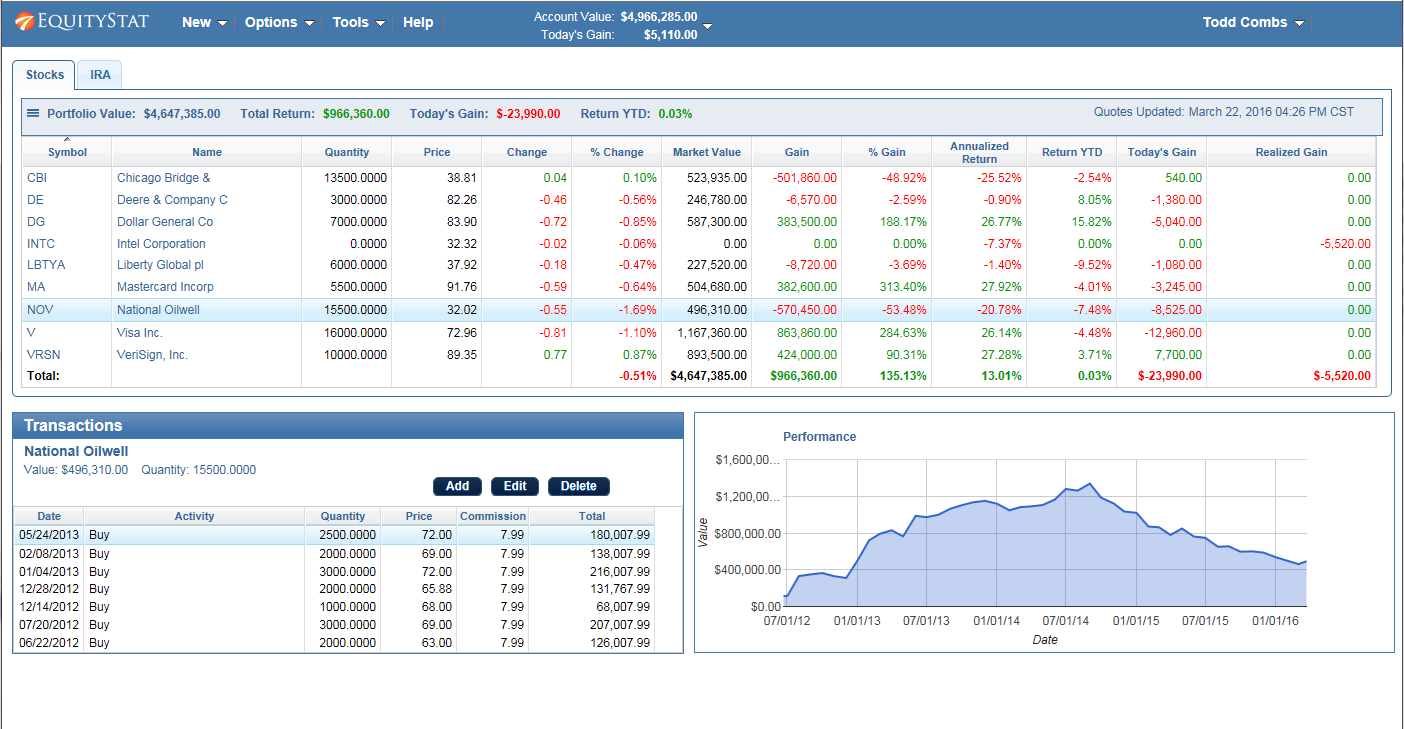
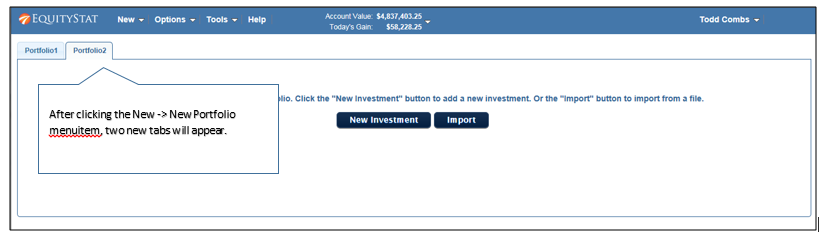
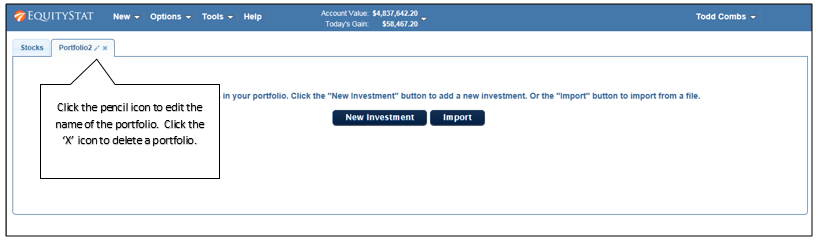
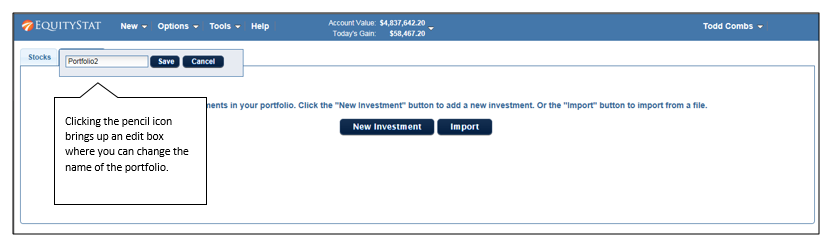
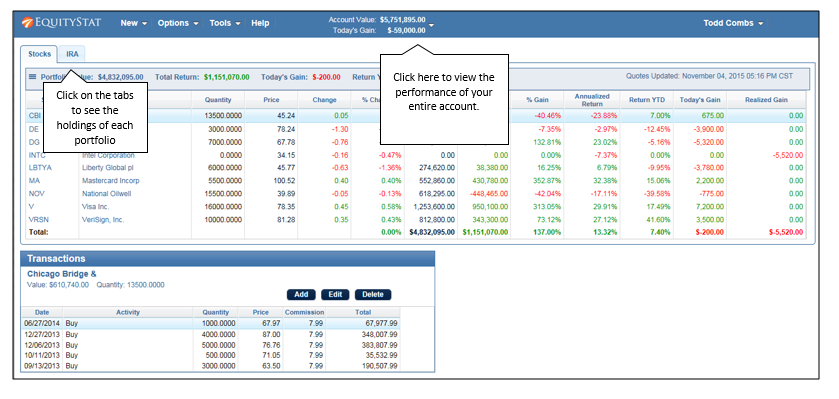
With EquityStat you can easily add, edit and delete your investment transactions. You can also easily view your transactions for each investment. In addition you can import these transactions into your portfolio by either manually entering them or importing them from a spreadsheet. If you want to save your transactions to your computer, you can export the transactions for each investment to a spreadsheet.
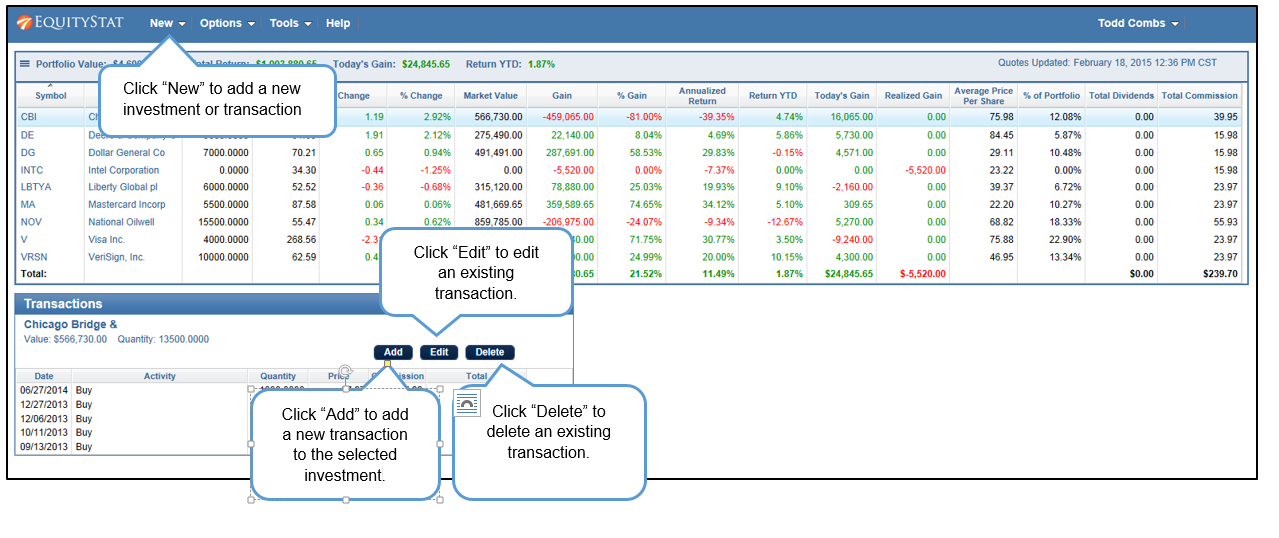
If you are looking for portfolio manager that supports transactions, checkout EquityStat.