Splitting a Stock in EquityStat

Amazon’s (AMZN) stock recently split. It was a 20 for 1 stock split. So, for each share you owned before the split, you got 20 shares.

If you owned Amazon (AMZN) stock before the split and you are tracking this stock in your EquityStat portfolio, how do you record the split?

First, select the Amazon stock in your investment panel. Next, in the transaction panel, click the Add button to add a new transaction. In the Activity drop down, choose a “Split” transaction. Enter how many shares were split, in this case it is a 20 for 1 split, and click the Add button to save the transaction.

Add a split transaction in EquityStat's investment portfolio tracker.
Adding a split transaction in your EquityStat portfolio

When the split transaction is saved, each transaction will be adjusted to reflect this split. The number of shares will be increased twenty times and the price will be divided by twenty.

For example, if you had the following transactions before the split.

EquityStat transactions for Amazon (AMZN) before the 20 for 1 split
Amazon transactions before the split

After the split your transactions will look like this.

EquityStat transactions for Amazon (AMZN) after the 20 for 1 split
Amazon transactions after the split

Notice that before the split there were three buy transactions. After the split, the number of shares has increased 20 times and the price has been reduced by a factor of twenty. For example, the initial buy on 4/02/2014 was for a quantity of 100 shares. After the split, the purchased quantity is 2000 shares. The price the shares were bought on 4/02/2014 was $341.96. After the split, the price paid was $17.098. These adjustments are all automatically done when you enter the split transaction.

If you have other stocks that have split, you can use the same steps to record your split. Just make sure that you enter the correct split information.
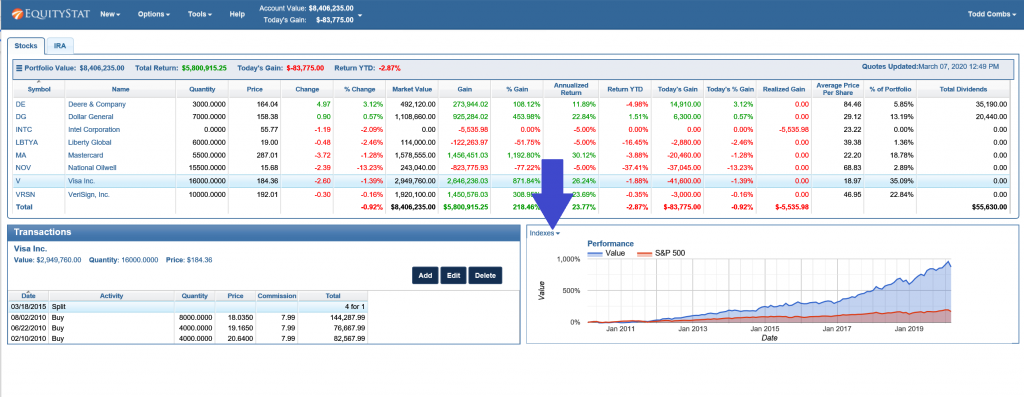
Feature Highlight – Compare Your Investment Performance to the Dow Jones, the Nasdaq or the S&P 500 Index

If you want to see how your investment performance is doing compared to an index, you can easily add an index to your investment’s performance graph.

To do this, select the index you want to compare, by clicking on the Indexes drop down menu link in the upper left hand corner of the performance graph.

Compare Stock Performance to Indexes
Compare Investment Performance to Indexes

When you click on the Indexes drop down menu link, you can choose from a list of indexes.

Choose to compare your stock's performance to the Dow Jones index, the Nasdaq index or the S&P 500 index
Choose to compare your stock’s performance to the Dow Jones index, the Nasdaq index or the S&P 500 index

Choose the Dow Jones index, the Nasdaq index or the S&P 500 index. You can choose one index or multiple indexes. When you choose an index, you will see a checkbox next to the index.

Once an index is chosen, you will see the index in your performance graph and how it compares to your investment’s performance.

To remove an index, click on the Indexes drop down link and select the index again. This will remove the checkbox from the index menu item and remove the index from your performance graph.

You can also compare your account/portfolio performance to an index. To do this, go to the Portfolio Analysis page by choosing the Tools menu at the top and selecting Analyze Portfolio from the drop down menu. From the Portfolio Analysis page, click the Indexes link above the performance graph and choose the index or indexes you want to compare.

Choose to compare your account/portfolio performance to the Dow Jones index, the Nasdaq index or the S&P 500 index

View Your Portfolio On Your Mobile Device

We have recently added the ability to view your portfolio on your mobile device. To view your portfolio on your mobile phone, launch your phone’s web browser and go to www.equitystat.com. Next, login to your EquityStat account. You will then see a scaled version of your portfolio designed to display on your mobile device.

Watch the following video to learn more about the features of the mobile portfolio manager.

EquityStat and Taxes

It’s that dreaded time of year – tax time. EquityStat’s portfolio manager has several tools to help investors with their taxes.

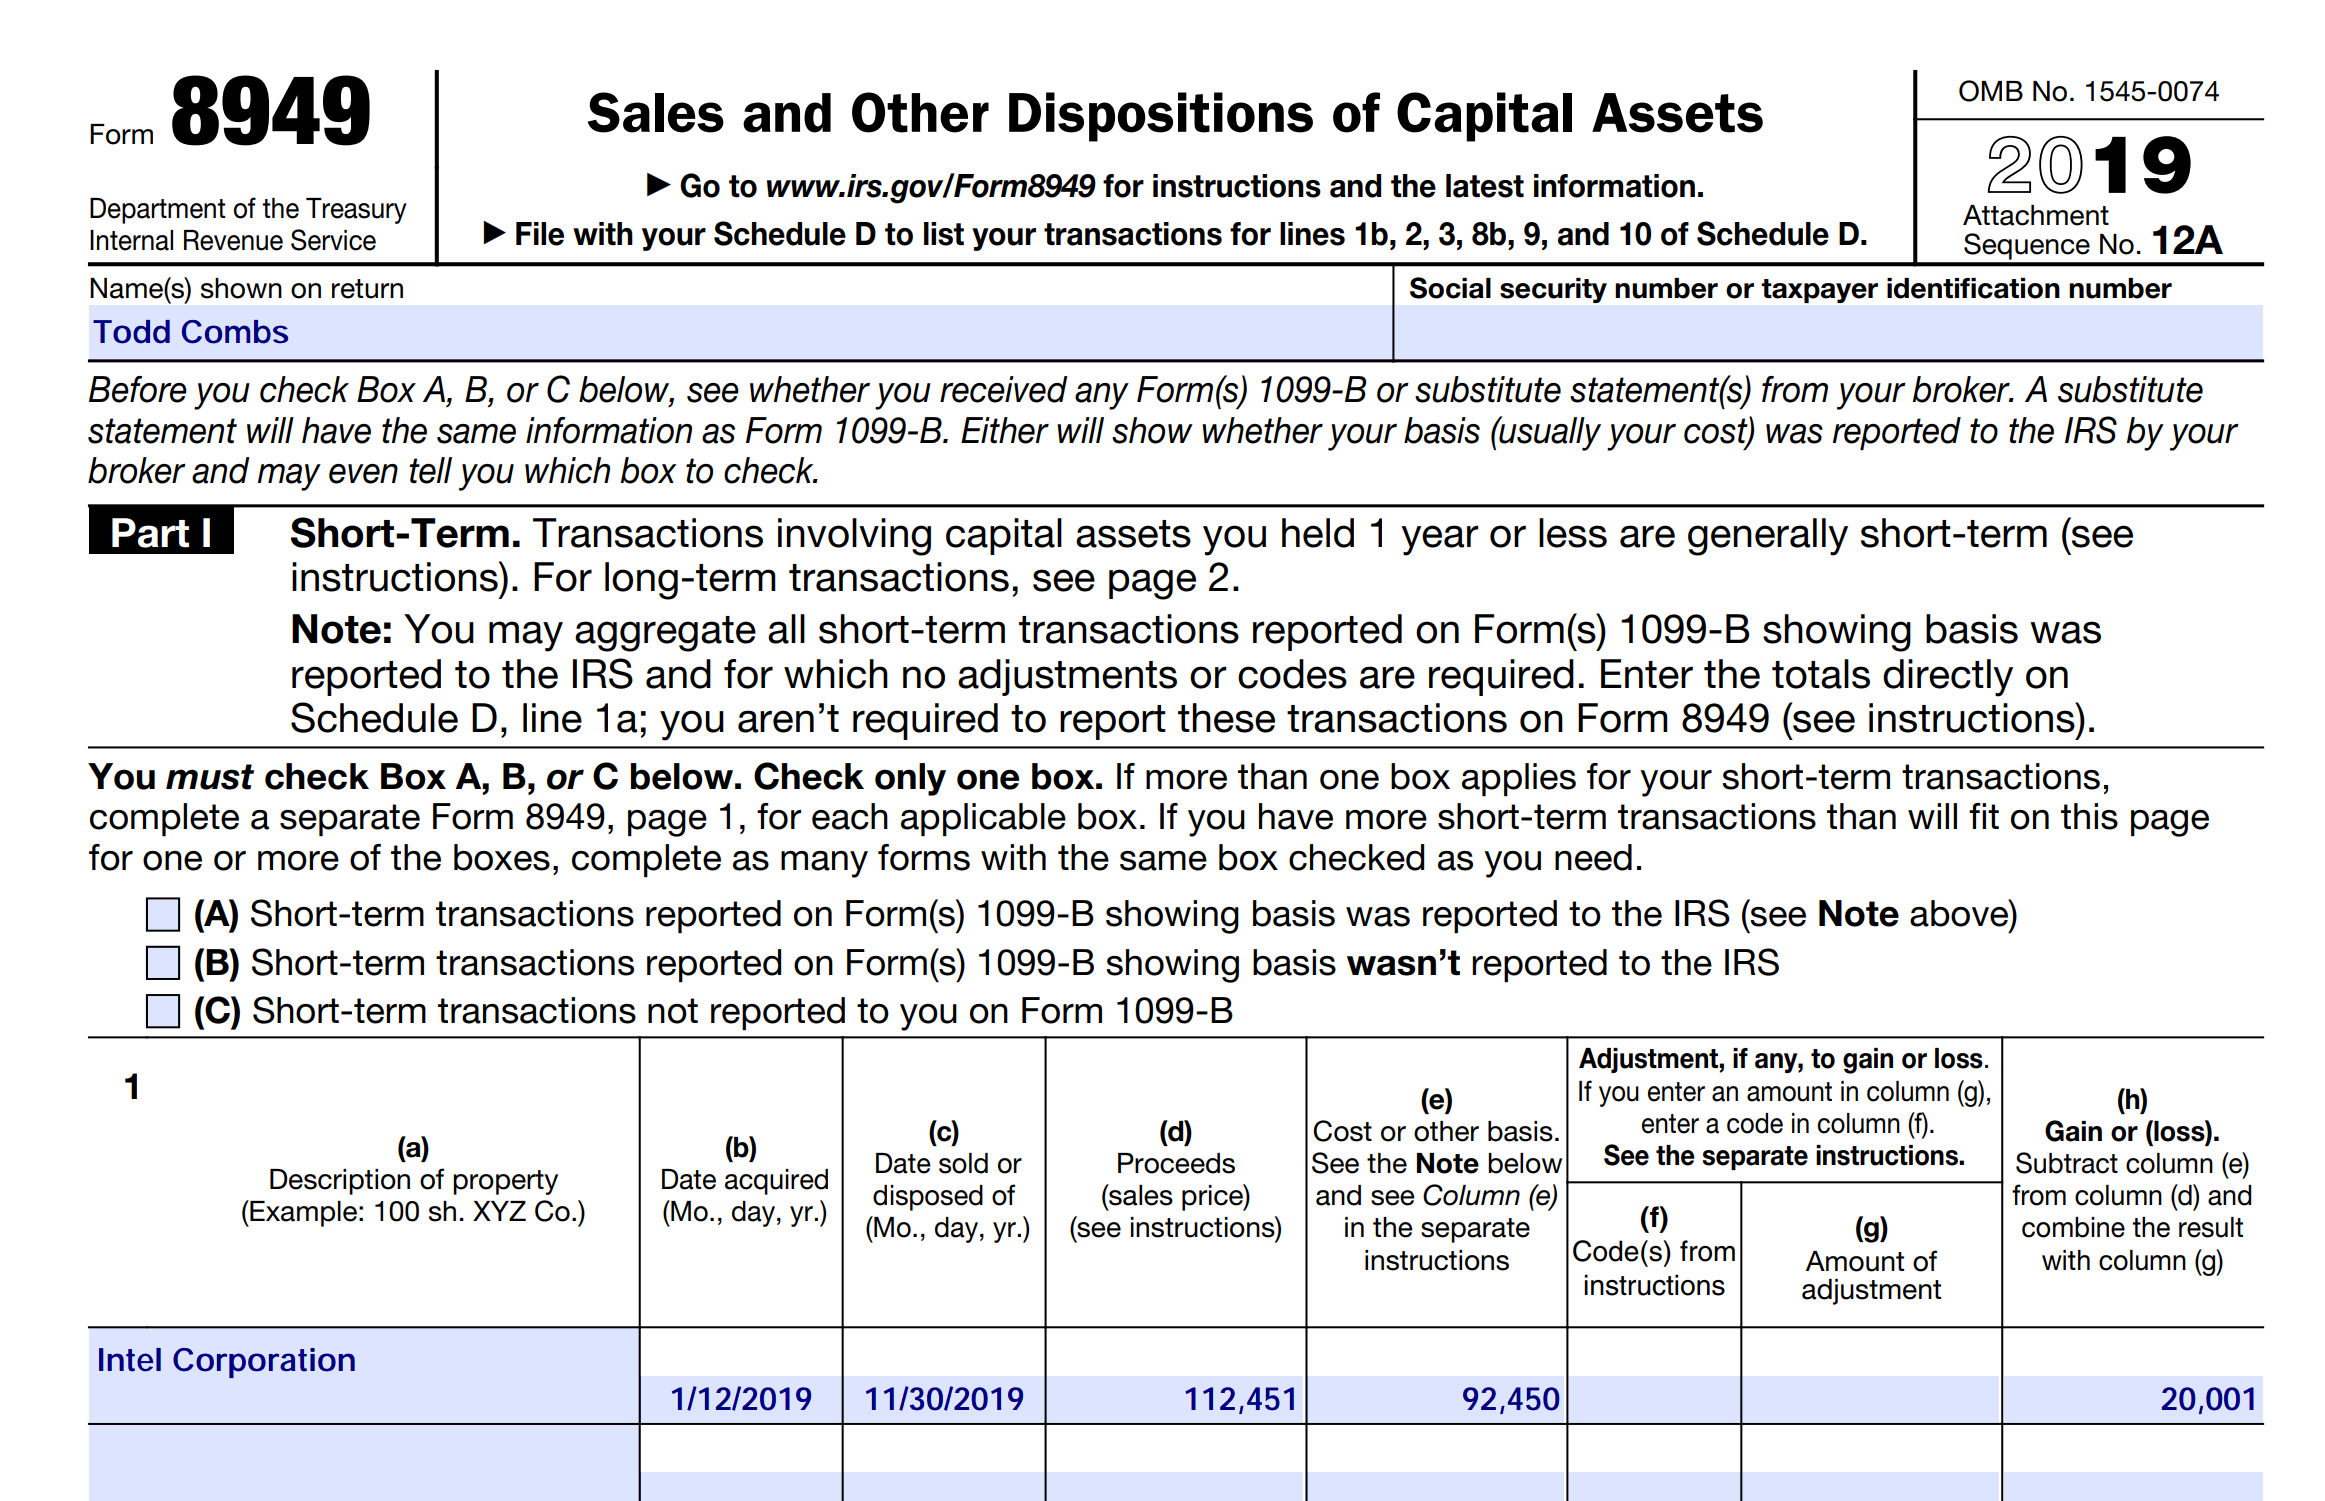
If you sold any shares last year, you can use EquityStat to generate IRS Form 8949.  IRS Form 8949 is a form that shows your short-term  and long-term capital gains on any investment sale.  EquityStat will automatically calculate these capital gains.  It will then generate a PDF of Form 8949 with all needed information that the IRS requires.  You can then give this form to your tax preparer when you are preparing your taxes.  To generate IRS Form 8949, click the Tools menu and then choose the Generate Form 8949 menuitem.

Use EquityStat To Print IRS Form 8949
IRS Form 8949 Example

Another tool to help you with your taxes is the ability to export your investment’s transactions to a spreadsheet. To export your transactions, click the Tools menu and then choose the Export Transactions menuitem. When you export your transactions, you will get a spreadsheet showing each transaction for the investment including the type of transaction it is (e.g. Buy, Sell, Dividend, etc). With this information, your tax preparer can calculate your taxable capital-gains and taxable dividends for all of your investments.

Worst Stock of 2016

According to the Wall Street Journal the worst S&P 500 stock of 2016 was Endo International.  It was down 73%.

You can see the list of worst stocks here:

http://blogs.wsj.com/briefly/2016/12/30/5-worst-performers-in-the-sp-500-in-2016/

How did your investments do in 2016?  What was your worst stock?  If you are not tracking your investment’s performance, consider using EquityStat.  With EquityStat you can track the overall performance of your portfolio/account as well as the performance of each individual investment.  EquityStat tracks the annualized return, year to date return, daily gain, overall gain and many other metrics of your investments.  With these metrics you can easily determine what are your best investments.

Many online brokerages and mutual funds track an individual stock or mutual fund’s performance but you cannot get the overall return of all your stocks or mutual funds.  With EquityStat not only can you get the return each investment, you can also get the return for your entire account.  This way you know how well your investments are performing at any time.

Best Stock of 2016

According to the Wall Street Journal the best S&P 500 stock of 2016 was Nvdia.  It was up 224%.

You can see the list of best stocks here:

http://blogs.wsj.com/briefly/2016/12/30/5-best-performers-in-the-sp-500-in-2016/

How did your investments do in 2016?  What was your best stock?  If you are not tracking your investment’s performance, consider using EquityStat.  With EquityStat you can track the overall performance of your portfolio/account as well as the performance of each individual investment.  EquityStat tracks the annualized return, year to date return, daily gain, overall gain and many other metrics of your investments.  With these metrics you can easily determine what are your best investments.

Many online brokerages and mutual funds track an individual stock or mutual fund’s performance but you cannot get the overall return of all your stocks or mutual funds.  With EquityStat not only can you get the return each investment, you can also get the return for your entire account.  This way you know how well your investments are performing at any time.


How did your investments perform in 2016?

How did your investments do in 2016?  What was your best stock?  What was your worst?

If you are not tracking your investment’s performance, consider using EquityStat.  With EquityStat you can track the overall performance of your portfolio as well as the performance of each individual investment.  EquityStat tracks the annualized return, daily gain, overall gain and many other metrics of your investments.  With these metrics you can easily determine what are your best investments and what are your worst investments.

EquityStat Financial Portfolio Analysis
Portfolio Analysis Example

In addition EquityStat provides an analysis of your account and portfolios.  With our account/portfolio analysis you can get a graphical and tableuare view of the performance of your investments.  For example, you can see the performance of your account/portfolio overtime.  Using the account/portfolio analysis you can also see which investments were your best performing investments and which investments were your least performing investments.

Portfolio Analysis – New Feature

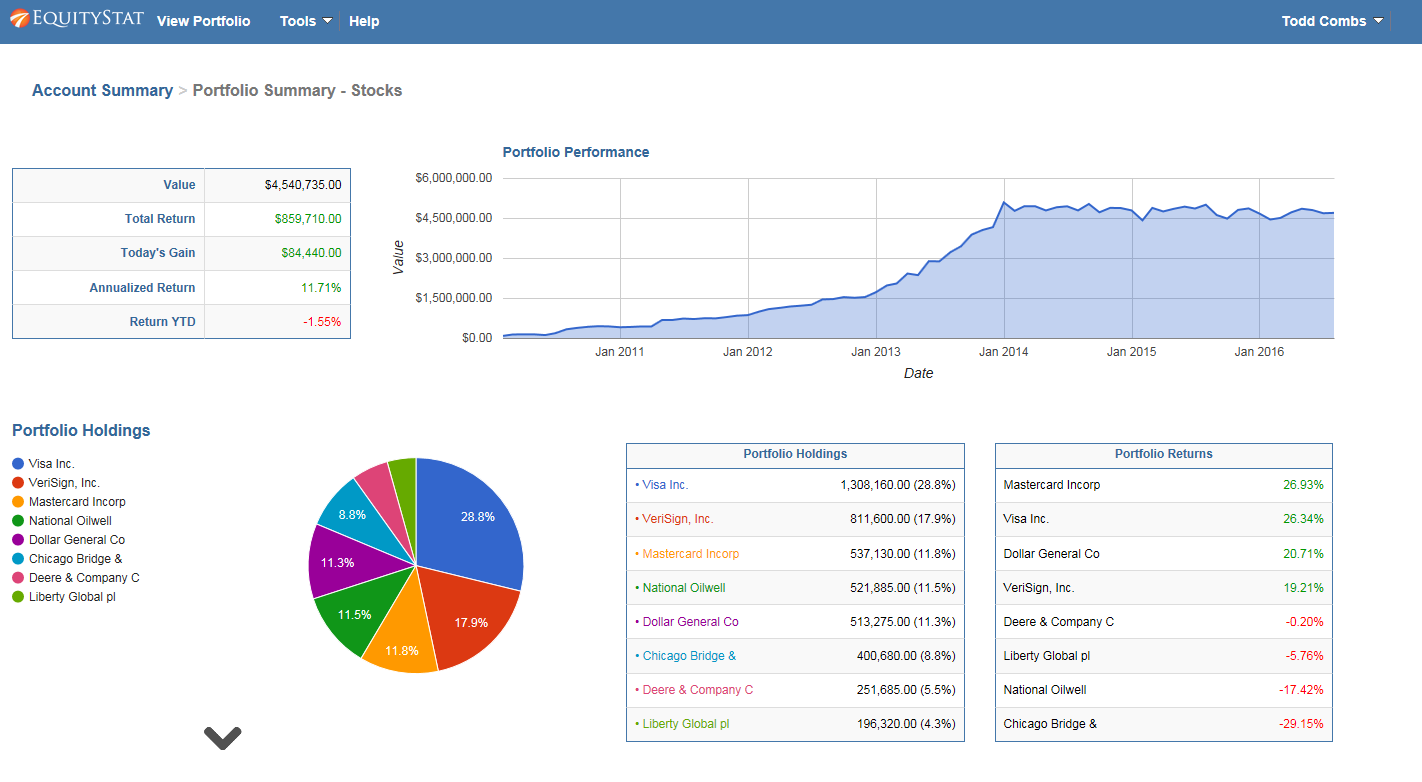
We have recently added a new feature.   You can now get an analysis of  your account and portfolios.  To perform a portfolio analysis click the Tools menu and choose Analyze Portfolio from the drop down menu.

EquityStat Investment Portfolio Analysis
Stock Portfolio Analysis Page

Our portfolio analysis feature provides you an performance overview of your account/portfolio.  You can easily see how your account/portfolio is performing over time, the holdings in your account/portfolio and performance metrics for each investment in your account/portfolio.

If you have multiple portfolios, the analysis page will first display how your entire account is performing.  You can see performance metrics for each individual portfolio and a graph showing the growth of your account over time.  In addition you can see your account’s investment holdings and a ranking of each investment return.  The analysis will also provide performance metrics on each investment.  You can see which investment is your best/lowest for the day, quarter and the year.  A list of your best investments and a list of your lowest investments is also provided.

If you want to see an analysis of each individual portfolio click on the portfolio name in the portfolio summary table.  You will then be shown an analysis for that portfolio.  You will get the same graphs and performance metrics that were provided on the account level, but for the individual portfolio.

If you only have one portfolio, by default you will be shown the analysis for your only portfolio.

5 Frequently Asked Questions About EquityStat’s Portfolio Manager

5 Frequently Asked Questions

  1. How do I add a new investment?
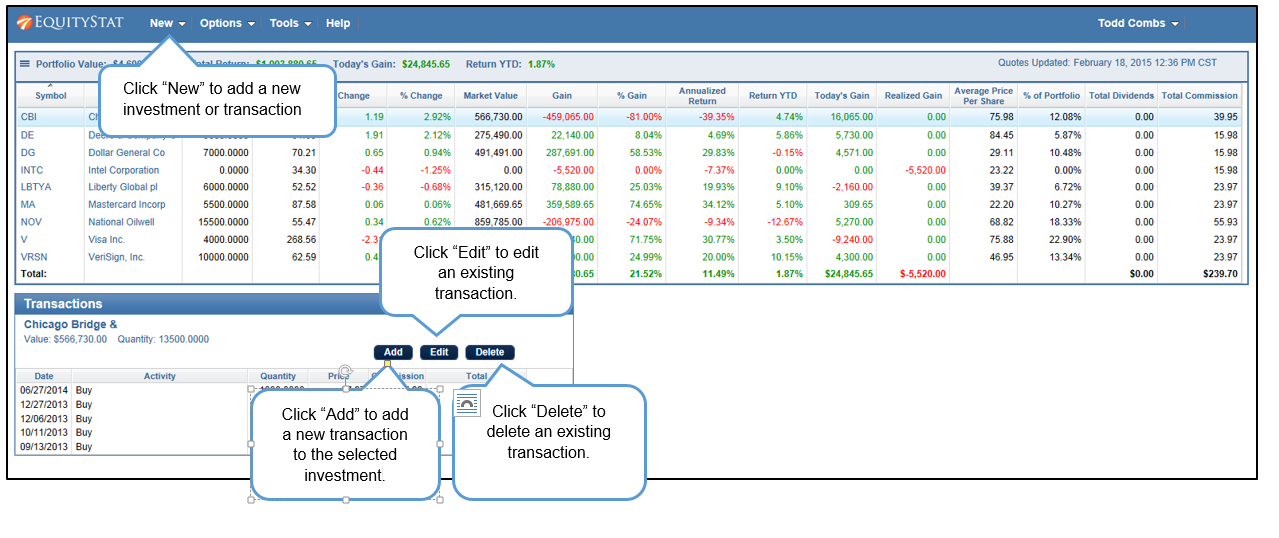
    Click the New Menu and then choose New Investment from the dropdown menuitem.  A popup dialog will appear where you can add your new investment.
  2. How do I add/remove a portfolio column?
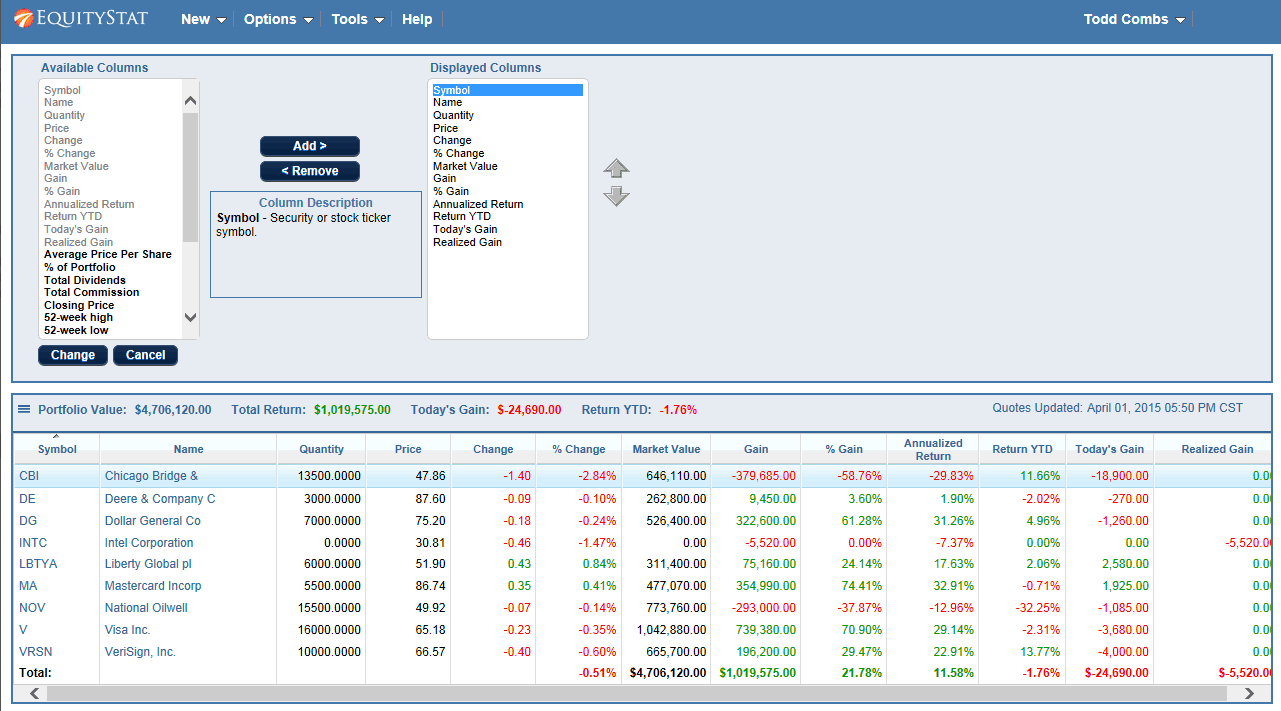
    Click the Options Menu and then choose Change Columns from the dropdown menuitem.  The Change Columns panel will appear.  To add a column select the column from the Available Columns list and click the Add button to add it to the Displayed Columns list.  To remove a column select the column from the Displayed Columns list and click the Remove button to remove it from the Displayed Columns list.  Click the Change button to save your columns.

    EquityStat Investment Portfolio Change Performance Metric Columns
    Change Stock Portfolio Columns
  3. How do I change the order of the displayed columns?
    Click the Options menu and choose the Change Columns dropdown menuitem.  The Change Columns panel will appear.  Select the column you want to change from the Displayed Columns list.  Use the up/down arrows on the right to change the order.   When finished click the Change button to save your changes.
  4. How do I sort the portfolio by Investment name?  How do I sort any column in the portfolio?
    To sort your portfolio by investment name, click on the Name column heading.  To sort any columns, such as Market Value, click on the column heading.  Clicking on the column heading will also toggle the sort between ascending and descending order.
  5. How do I sell an investment?
    To sell an investment add a “Sell” transaction.  To add a “Sell” Transaction, first select the investment you want to sell.  Next click the Add button in the Transactions section.  A popup panel will appear.  Enter your date, choose “Sell” from the Activity dropdown and enter how many shares you sold and the price you sold them at.  Click the Add button to save your changes.

    EquityStat Stock Market Portfolio Add Transaction
    Add Transaction Directions

New Column Options

We recently added two new column options to our portfolio manager.  You can now display the Ex-Dividend Date and Dividend Paid Date for each of your investments.  To display these columns in your portfolio, click the Options menu and then choose the Change Columns menuitem.  A drop down panel will then appear.  Select the column from the list of Available Columns and add it to the list of Displayed Columns.  Click the Change button and your new columns will display in the portfolio.

In addition to these two columns, we provide a whole range of other columns you can add to your portfolio.  These columns vary from information about your investment to performance metrics.  Just add/remove the columns to configure your portfolio to your specifications.