By default we display a pre-configured set of columns for your portfolio. If you desire you can easily change the columns that are displayed in your portfolio. To do this click the Options link at the top of your portfolio and choose the Change Columns menuitem.
Change Columns In Your Portfolio
Clicking the Change Columns menuitem will display a list of columns that are available and a list of columns your are currently using. You can add and remove columns as well as change the order of your columns. If you want a description of a column, just click on the column in either of the lists.
When you are finished change your columns, click the Change button to save your changes and get back to your portfolio.
Do you have a lot of transactions that you need to import into EquityStat that you don’t want to manually enter? If so then you can use EquityStat’s import feature to import these transactions.
To import your transactions first get these transactions into a CSV (comma separated variable) file. The easiest way to generate a CSV file is to use Excel or any other spreadsheet application. With Excel you can enter your data into a spreadsheet and then save the file as a CSV file.
The CSV file must be in a certain format for you to import your transactions into your portfolio. The first line in the file must identify what each column is. The following column indentifiers are valid – Symbol, Date, TranType, Quantity, Price, Amount, Commission.
The valid values for the TranType column are Buy, Sell, Div, Rediv (Re-invested Dividend), Longcg (Long-Term Capital Gain), Shortcg (Short-Term Capital Gain), Relongcg (Re-Invest Long Term Capital Gain), Reshortcg (Re-Invest Short Term Capital Gain).
If you have a TranType value of Div then you will need an Amount column and you will not need the Quantity and Price column. If you have a TranType value of something other than a non re-invested dividend or non re-invested capital gain, you will need a Quantity and Price column. All rows must have a Symbol and Date column.
Here is a screen shot of a sample Excel file in the proper format.
Import transactions into EquityStat
Once you have your data entered in your spreadsheet, save it as a CSV file.
Next, login to your portfolio and click the New menu and choose Import Transactions. Then from the Import page, upload your CSV file from your computer. The transactions that will be imported will then be displayed. If everything is correct, continue the import process.
If you have any questions with how to do an import, feel free to contact our support desk by clicking the Help link from our home page.
If you read Berkshire’s annual letter, you can gain a lot of insight as to what Buffett thinks of Berkshire. So based on the 2014 annual letter, does Buffett think Berkshire’s stock is undervalued, overvalued or just right?
First, Buffett has always said, over time Berkshire’s stock price will reflect the intrinsic value of the business. Calculating Berkshire’s intrinsic value is not a precise exercise but a lot of analysts do it, including Buffett and Munger.
In his 2014 annual letter, Buffett points out several times that the value of an asset on the books is a lot less than the true or intrinsic value of the asset. For example, when discussing Berkshire’s insurance float he says
Charlie and I believe the true economic value of our insurance goodwill – what we would happily pay for float of similar quality were we to purchase an insurance operation possessing it – to be far in excess of its historic carrying value. Under present accounting rules (with which we agree) this excess value will never be entered on our books. But I can assure you that it’s real. That’s one reason – a huge reason – why we believe Berkshire’s intrinsic business value substantially exceeds its book value.
When discussing the businesses that make up Berkshire, Buffett says
Furthermore, the intrinsic value of these businesses, in aggregate, exceeds their carrying value by a good margin, and that premium is likely to widen. Even so, the difference between intrinsic value and carrying value in both the insurance and regulated-industry segments is far greater. It is there that the truly big winners reside.
And finally, Buffett points out that the peculiarities of Marmon’s rail car business which causes Marmon’s book value to be undervalued.
One further fact about our rail operation is important for you to know: Unlike many other lessors, we manufacture our own tank cars, about 6,000 of them in a good year. We do not book any profit when we transfer cars from our manufacturing division to our leasing division. Our fleet is consequently placed on our books at a “bargain” price. The difference between that figure and a “retail” price is only slowly reflected in our earnings
through smaller annual depreciation charges that we enjoy over the 30-year life of the car. Because of that fact as well as others, Marmon’s rail fleet is worth considerably more than the $5 billion figure at which it is carried on our books.
Based on these quotes is Buffett hinting that book value is substantially under intrinsic value? And since Buffett believes stock price will eventually be the same as intrinsic value, does Buffett believe Berkshire’s stock price is undervalued?
On Saturday Warren Buffett released his annual letter on Berkshire Hathaway. If you are an investor it is a must read. Here are the best quotes from the letter.
On Berkshire’s Investments
… stock repurchases at Coca-Cola, American Express and Wells Fargo raised our percentage ownership of each. Our equity in Coca-Cola grew from 9.1% to 9.2%, our interest in American Express increased from 14.2% to 14.8% and our ownership of Wells Fargo grew from 9.2% to 9.4%. And, if you think tenths of a percent aren’t important, ponder this math: For the four companies in aggregate, each increase of one-tenth of a percent in our ownership raises Berkshire’s portion of their annual earnings by $50 million.
On BNSF Railroad
BNSF, like all railroads, also moves its cargo in an extraordinarily fuel-efficient and environmentally friendly way, carrying a ton of freight about 500 miles on a single gallon of diesel fuel. Trucks taking on the same job guzzle about four times as much fuel.
Elephant Hunting or Tuna Fishing?
In past letters Buffett has said he is elephant hunting for new businesses. He is now fishing.
With the acquisition of Van Tuyl, Berkshire now owns 9 1⁄2 companies that would be listed on the Fortune500 were they independent (Heinz is the 1⁄2). That leaves 490 1⁄2 fish in the sea. Our lines are out.
Investing Wisdom
… my experience in business helps me as an investor and that my investment
experience has made me a better businessman. Each pursuit teaches lessons that are applicable to the other. And some truths can only be fully learned through experience. (In Fred Schwed’s wonderful book, Where Are the Customers’ Yachts?, a Peter Arno cartoon depicts a puzzled Adam looking at an eager Eve, while a caption says, “There are certain things that cannot be adequately explained to a virgin either by words or pictures.”
For the great majority of investors, however, who can – and should – invest with a multi-decade horizon, quotational declines are unimportant. Their focus should remain fixed on attaining significant gains in purchasing power over their investing lifetime. For them, a diversified equity portfolio, bought over time, will prove far less risky than dollar-based securities.
Funny
The gecko, I should add, has one particularly endearing quality – he works without pay. Unlike a human spokesperson, he never gets a swelled head from his fame nor does he have an agent to constantly remind us how valuable he is. I love the little guy.
When I was a teenager– in my one brief flirtation with honest labor – I tossed about 500,000 papers.
Benjamin Franklin Wisdom
Buffett always has some common sense wisdom in his letters.
It’s better to have a partial interest in the Hope Diamond than to own all of a rhinestone.
In the world of business, bad news often surfaces serially: You see a cockroach in your kitchen; as the days go by, you meet his relatives.
Market forecasters will fill your ear but will never fill your wallet.
We’ve found that if you advertise an interest in buying collies, a lot of people will call hoping to sell you their cocker spaniels.
… never underestimate the man who overestimates himself.
Dividend?
Buffett has always said Berkshire won’t pay a dividend but hints that they might in the future.
Eventually – probably between ten and twenty years from now – Berkshire’s earnings and capital resources will reach a level that will not allow management to intelligently reinvest all of the company’s earnings. At that time our directors will need to determine whether the best method to distribute the excess earnings is through dividends, share repurchases or both.
Here is a quick getting started guide for using EquityStat’s portfolio manager.
Add transactions to EquityStat
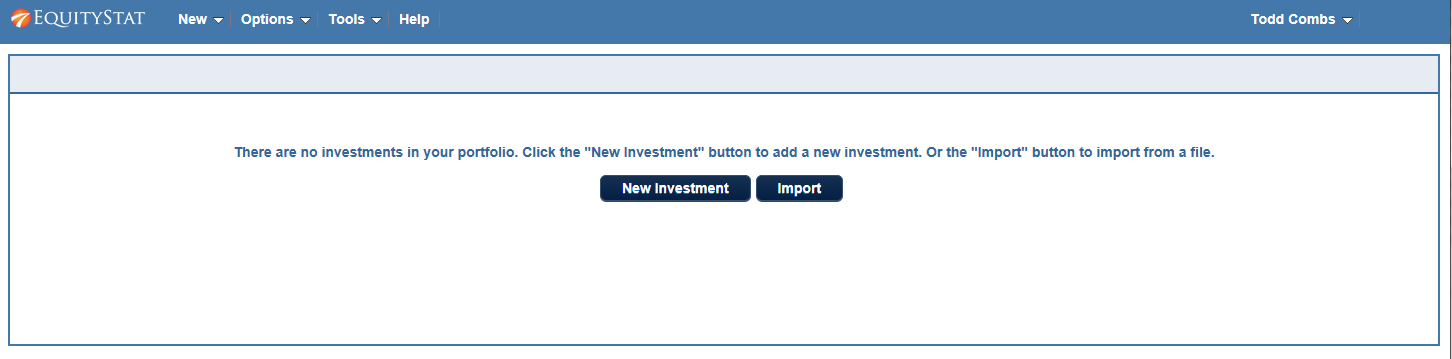
After you join EquityStat, you will be logged into your account. Since you have no investments in your portfolio, you will see the page above. From this page you can click the New Investment button to add a new investment to your portfolio.
After clicking the New Investment button, you will be presented a dialog where you can enter a buy transaction for your investment. Using the dialog, enter the symbol of your investment, the date the purchase took place, the amount of shares purchased and the price for each share. When finished click the Save button. Once you have entered your first purchase, you can then enter other transactions such as other buys, sells and dividends.
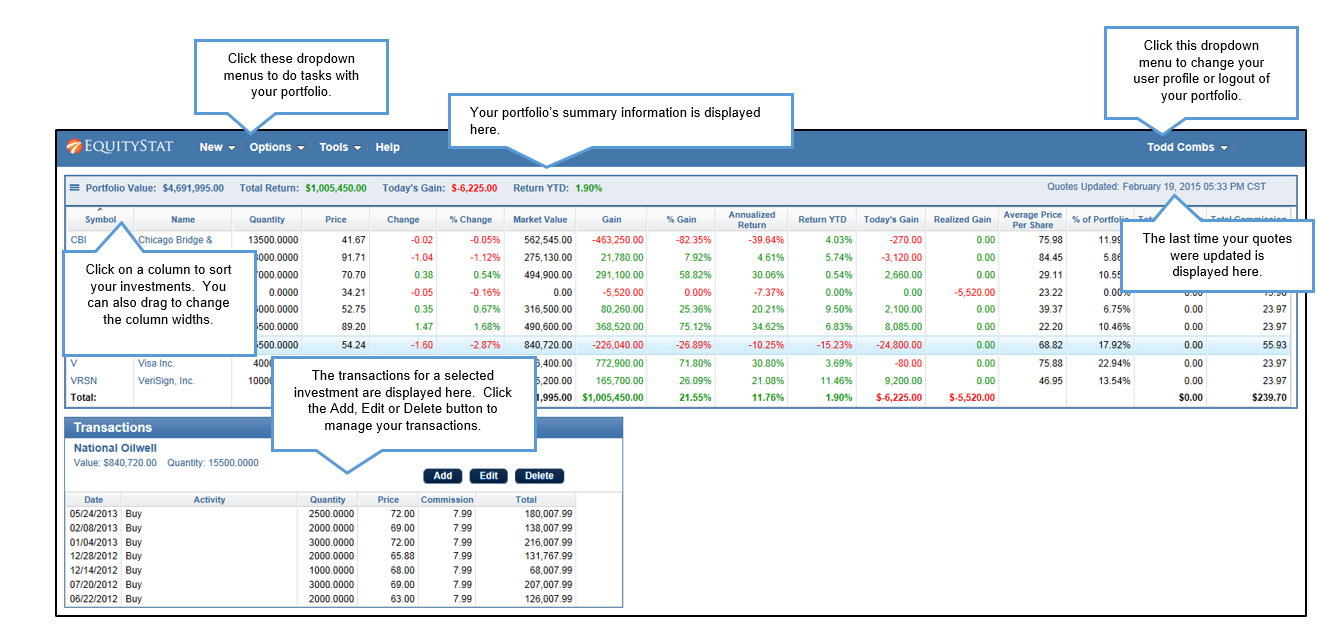
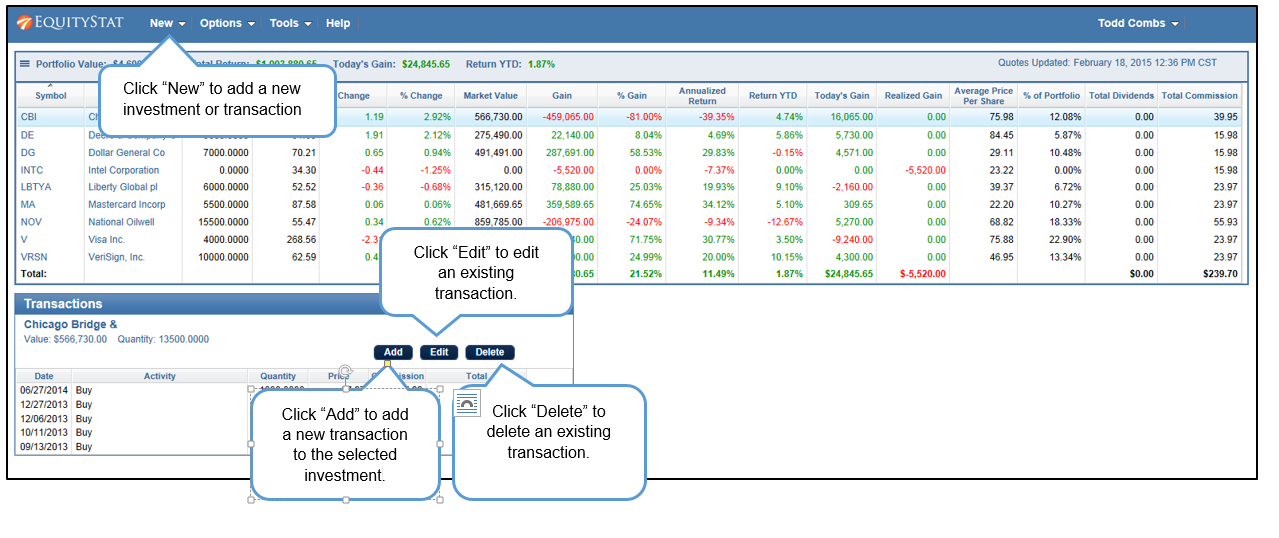
Directions on EquityStat’s Portfolio Manager
The image above shows a portfolio with several investments already entered. The top table will show all of your investments along with data about the investments. Below the investment table are the transactions for the selected investment. You can sort your investments and transactions by clicking on a column heading. In addition you can expand a column by putting your mouse between columns and then drag to lengthen the width of the column. Above the investment table is a summary of the portfolio which will show you the total portfolio value, the total dollar return, the gain/loss for the day and the year-to-date return.
How to add transactions to EquityStat
If you want to enter a new investment that is not in your portfolio, click the New menu and then choose the New Investment menuitem. If you want to add transactions to an existing investment, go to the transaction table below the investment table and click the Add button. A new row will then be added to the transaction table where you can add a new buy, sell, dividend transaction as well as many other transaction types. You can also edit an individual transaction by selecting the transaction and clicking the Edit button. If you want to remove a transaction, click the Delete button.
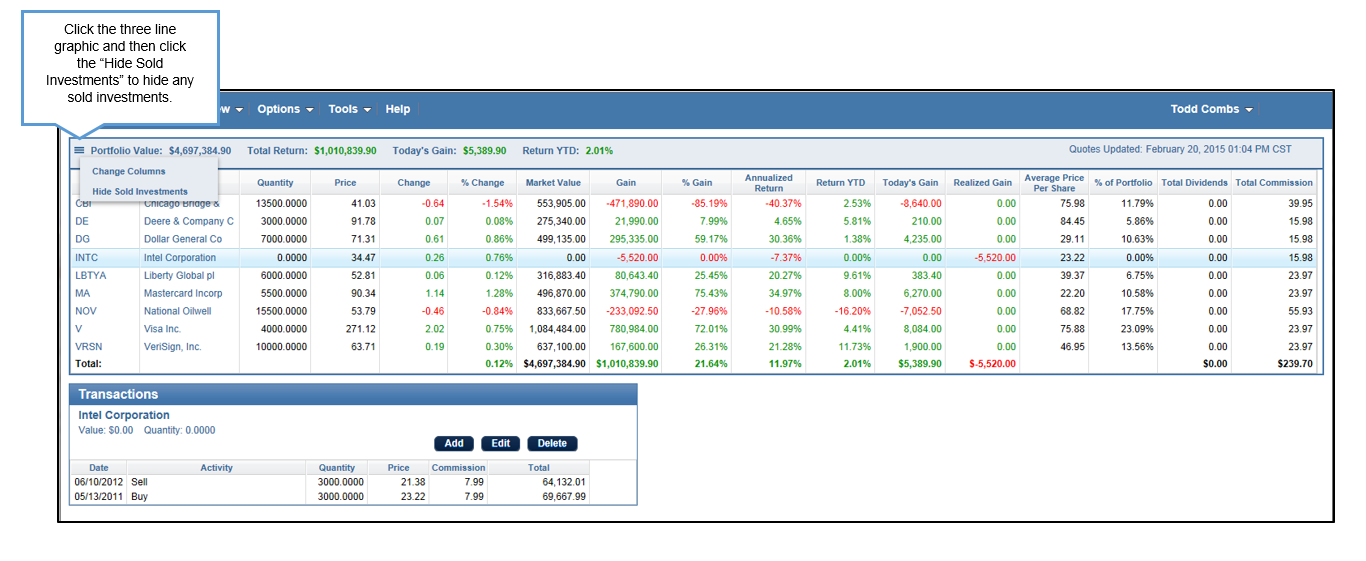
How to hide sold investments in your portfolio
If you have investments in our portfolio that have been sold and you don’t want them to show, click the three line graphic at the left and choose Hide Sold Investments menuitem. This will hide any sold investments. To view your sold investments click the graphic again and choose View Sold Investments.
The original value of an asset for tax purposes (usually the purchase price), adjusted for stock splits, dividends and return of capital distributions. This value is used to determine the capital gain, which is equal to the difference between the asset’s cost basis and the current market value. Also known as “tax basis”.
Why is it important?
The IRS is requiring more and more reporting of your cost basis of your investment. They also require your report the capital gains/losses of your investments. To calculate your capital gains you need to know your cost basis.
How do you calculate it?
On the surface calculating cost basis sounds easy. Just use the price you paid for your stock. For example, if you purchased a 100 shares of XYZ company for $120 then your cost basis is $120. However, things get complicated if you had 3 for 2 stock split. Also, what if you purchase an additional 50 shares for $90? What if you have a split, reinvest capital gains and purchases in a given year? What is your cost basis? Now things get really complicated.
How EquityStat makes things easier
With EquityStat all you have to do is enter your purchases, splits, capital gains and we will calculate your cost basis. Then when you sell your stock whether all of your shares or just some of your shares, we can easily calculate your gain or loss. You can then generate IRS Form 8949 that will show your cost for each investment you sold in the last year.
Do you use TurboTax to calculate your investment gains and losses? Do you use TurboTax to generate form Schedule D or Form 8949? If so be aware that TurboTax is now charging extra for these features.
In addition to paying $59.99 for the Deluxe version of Turbo tax, if you want to calculate your investment capital gains or losses from stock, mutual fund or ETF sales you will have to pay an additional $20 or $30.
You can read more about the changes to TurboTax here.
If you are looking for an alternative to TurboTax for calculating your capital gains or losses, checkout EquityStat. With EquityStat you can generate IRS Form 8949 . Form 8949 is used to report your short and long term capital gains and loses. Once you enter your purchases and sales of your investments into EquityStat, you can then generate Form 8949 and use this form to fill out your Schedule D Form.
The IRS is requiring more reporting when you sell your investments. Specifically, they require you to report the investment cost, cost basis in investment terminology, and the gain/loss from the investment sale. If you purchase 100 shares of a stock and sell 100 shares of the stock, your cost basis is easy to calculate. Things get more difficult when you purchase shares in different lots. For example, you purchase 100 shares in 2011, 50 shares in 2012, 200 shares in 2013 and sell 160 shares in 2014.
Form 8949
What is your cost basis in the above scenario? This is not an easy calculation to do. To make things even more difficult, you have to report both your short term gains and long term gains to the IRS separately. Fortunately, EquityStat makes this easy. EquityStat calculates your cost basis for each investment and can also generate IRS Form 8949 which is a report that shows your gain/loss on each investment sold. Your tax preparer can then use Form 8949 to create the IRS Schedule D form.
To Generate Form 8949, click the Tools menu at the top of the portfolio and then click the Generate IRS Form 8949. Choose your tax year and EquityStat will generate the report showing both your short term and long term gain/loss on each investment you sold during the tax year.
According to the Wall Street Journal the best stock of 2014 was Southwest Airlines (LUV). It was up 123%. The worst stock of 2014 was Transocean (RIG). It was down 62%.
How did your investments do in 2014? What was your best stock? What was your worst?
If you are not tracking your investment’s performance, consider using EquityStat. With EquityStat you can track the overall performance of your portfolio as well as the performance of each individual investment. EquityStat tracks the annualized return, daily gain, overall gain and many other metrics of your investments. With these metrics you can easily determine what are your best investments and what are your worst investments.
If you own mutual funds why do you need a portfolio manager? Why can’t you just use the tools your mutual fund provides?
Transaction History
Many mutual funds do not provide all of your transaction history. They may provide up to 3 years of history but if you have owned your mutual fund longer than this, you do not have access to every transaction you have made.
Why is transaction history important? One, you need a complete transaction history for tax purposes if you sell shares in your mutual fund. Whenever you sell shares in a mutual fund you need to report to the IRS you gain or loss from to the sale. Without a complete transaction history you cannot accurately report the gain or loss, which may effect your taxes.
You also want a complete transaction history so that you can track your mutual fund’s performance over the history of the investment, not just over a limited time.
Performance Evaluation
Many mutual funds will provide you the yearly return of the mutual fund but this may not be the return your investment has made. For example, say you own the hypothetical mutual fund XRXRXR. Let’s say XRXRXR price on January 1 is $100 a share and on December 31 it is $110 a share. The mutual fund will report their yearly gain as 10%. However, this does not take into account when you bought your shares. Let’s say that on July 1 you buy shares at $90 a share. Based on a closing price of $110/share, your gain is 22% and not 10%. Or, let’s say you bought your shares at $120 a share. Based on a closing price of $110/share, your loss is 8% and not a 10% gain. If you rely on your mutual fund’s performance return it could be less or more than what you are actually earning.
EquityStat
With EquityStat you can view the complete history of your transactions. In addition EquityStat gives you the ability to generate IRS form 8949 which will calculate any gains or losses on the sale of your mutual fund shares.
EquityStat will also calculate the annualized return on all of your investments. This calculation is based on when you purchased and sold your shares, not what the mutual fund reports their return is.